1. Describe the task
Combine your research expertise with Claude's ability to extract themes and restructure content. Together, you'll learn to identify compelling findings, build narrative arcs, and create clarifying visuals while Claude handles the formatting details.
Tell Claude about your presentation context and then ask to extract key findings and create structured presentation materials from your research paper and any supporting data.
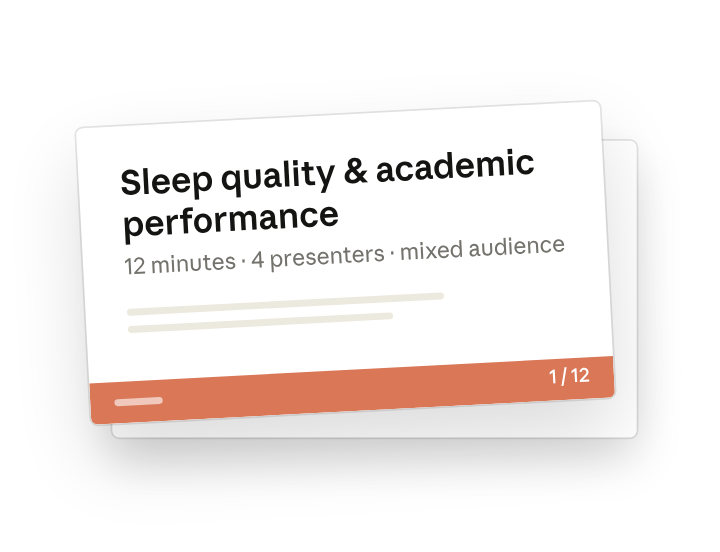
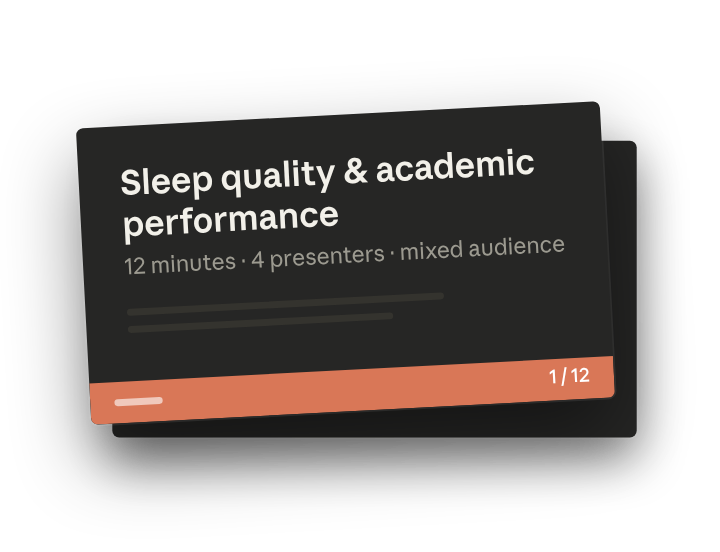
I'm uploading our group paper on sleep quality and academic performance. We have 12 minutes to present to a mixed audience of professors and students, with 4 presenters sharing the time. Analyze this research to:
- Extract the 3-4 most compelling findings that will resonate with our audience
- Create a logical narrative flow that builds from problem to insights to implications
- Design visual slides that simplify complex data without losing accuracy
Then create:
A Canva slide deck outline with clean visuals, data charts, and transitions—we'll open this in Canva to refine and add our own style
Speaker notes document with minimalist design, box structures, muted color palette, and clean sans-serif hierarchy. Add elements like a split workspace/reference column layout and use a functional modernist aesthetic so this document is easy to use while preparing.
2. Give Claude context
Provide your research materials and connect tools so Claude can create visual presentation elements and structured outlines.
Required context
Upload your research paper, any research data files, and your assignment rubric. Click the (+) button in the chat bar to browse through your files, or alternatively, drag and drop files into the chat box area.
Connect the Canva(opens in new tab) connector so Claude can generate complete slide decks that you can open and edit directly.
Enable the Google Drive(opens in new tab) integration for Claude to pull relevant files without manual uploads.

3. What Claude creates
Claude transforms your research into presentation materials structured for clarity and impact—slides outlined with sections from your research that are ready for editing and speaker notes that distribute content logically across presenters.
After analyzing your research, I've identified several compelling themes and connections:
1. Canva Presentation - Structured around discovered themes (ready for your refinement):
- Slides organized by the patterns that emerged from your data
- Visualizations that highlight unexpected correlations (sleep quality's 0.4 GPA impact connects to the 2.5x depression increase)
- A narrative arc that builds from individual behaviors to systemic implications
- Open in Canva to adjust design, emphasize key points, and add your own visual style
Choose your preferred design:
Design Option 1 | Design Option 2 | Design Option 3
2. DOCX Speaking Script - Maps how insights build on each other:
- Each section reveals findings that set up and reinforce the next discovery, creating a cohesive analytical journey
- Transitions that show how separate data points form a larger pattern when connected
- Natural progression where each presenter's insights become foundation for the next speaker's revelations
- Open in Word to personalize language, add your own examples, and practice your delivery style
View your speaker notes
4. Follow up prompts
Continue the conversation with Claude to refine, expand, or explore further.
Test your understanding
Practice articulating your findings out loud to catch unclear explanations before the actual presentation. Use voice mode(opens in new tab) on your mobile device to transcribe your presentation out loud and receive feedback.
I'm going to present my main findings as I would during the actual presentation. Tell me if my explanation is clear, if I'm missing important nuances, or if I should emphasize different aspects.
Refine specific slides
Iterate on the first output, by requesting alternative approaches for sections that aren't communicating effectively.
Slide 7 feels cluttered and the data visualization isn't clear. Here's what I want to communicate: [your idea]. Can you suggest three different visual approaches? I'll pick the one that fits best.
Prepare for Q&A
To ensure you're well-prepared for your presentation, ask Claude to help you anticipate potential questions so you can develop your thinking and practice responses beforehand.
Based on this presentation, what questions might professors ask? What are potential counter-arguments or opposing viewpoints I should prepare to address? I'll give you my responses and you can help me strengthen my answers.
5. Tricks, tips, and troubleshooting
Start with what you can't explain
When preparing for a presentation, tell Claude which parts of your own research you find hard to explain clearly. Claude can help you articulate complex concepts with clear language and relevant analogies.
Prevent formatting issues
Claude can make formatting errors, so explicitly mention to check for mistakes in your prompt. Ask Claude to verify no text or elements overlap and to use appropriate font sizes to prevent overcrowding on slides.
Use Claude for the heavy lifting
Let Claude quickly outline important sections and save you time that may have been spent copying and pasting content. After the first pass, use Claude to iterate on larger structural changes while tweaking colors and smaller details yourself.
Work iteratively
If the output isn't quite right, be specific in your request to Claude about what to change. Claude can regenerate sections, adjust color schemes, or restructure content based on your feedback.
6. Ready to try for yourself?
Work with Claude to understand how to best structure your research so you can present with genuine understanding and clarity.