1. Describe the task
Opus 4.6 follows leads across your connected tools without needing direction at each step. Give it a starting point and it pulls search terms from what it finds, follows people to their updates, follows updates to the data they reference, and reconciles sources that disagree. By the time it builds the deck, it's working from evidence it gathered and cross-referenced itself.
State the decision the deck has to support, lay out the path Claude should follow through your tools, and spell out the deliverables you expect back. The prompt below does all three: it anchors on the consolidation question, names the tracker to start from and the trail to follow outward, and asks for the deck, the appendix, and the brief by name.
I’m prepping for board meeting Friday. Q3 was the quarter where everything happened at once: we shipped the platform consolidation, closed the Apex partnership, and lost two enterprise accounts.
Start with the Q3 project tracker in my local files; it has the key people, channels, and documents. Follow each person across their channels, emails, and the documents they reference. Check the numbers you find against the live sources: the finance report on Drive and the Looker dashboard probably won’t agree on revenue. Figure out which is current, and grab the latest NPS from Delighted while you’re at it.
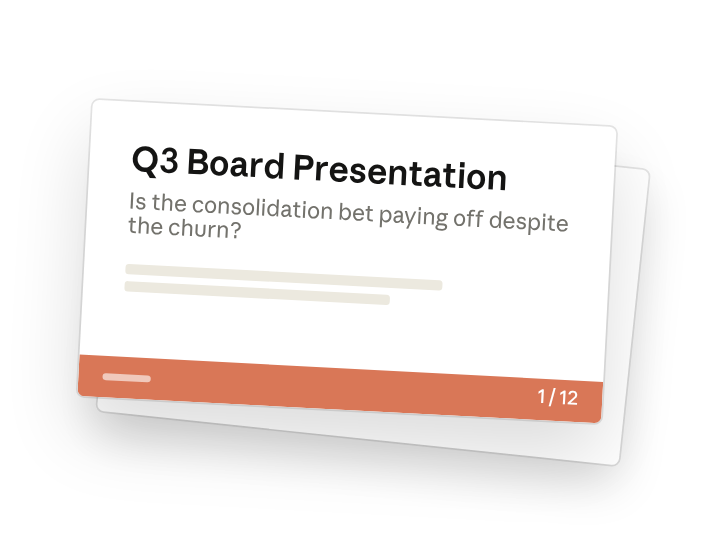
The board needs to understand whether the consolidation bet is paying off despite the churn. Create a PowerPoint deck (12–15 slides) with speaker notes, an Excel data appendix, and a two-page Word brief. Make an argument, not a summary.
2. Give Claude context
Through Cowork in Claude Desktop(opens in new tab), connect your local files and tools. Point Claude at a Slack channel, a Drive folder, or an email thread to give it a starting point.
Connect Slack and Google Drive through connectors. Claude in Chrome(opens in new tab) reads current numbers from live dashboards like Looker and Delighted.
What Claude gives you back is mostly determined by what you let it read. One more connected source usually improves the deck more than another rewrite of the prompt, so spend your setup time on access to the channels where the quarter was discussed, the folder with the finance report, and the dashboards you want checked.
Required context
- Cowork with access to local files (supported formats(opens in new tab))
- At least one connected source: Slack, Google Drive, or email
- Claude in Chrome(opens in new tab) for the dashboard checks the example prompt asks for

'%3e%3cpath%20d='M11.9091%2034H16.3636V23.6969L10%2019.1515V32.1818C10%2033.1879%2010.8559%2034%2011.9091%2034Z'%20fill='%234285F4'/%3e%3cpath%20d='M31.6364%2034H36.0909C37.1473%2034%2038%2033.1848%2038%2032.1818V19.1515L31.6364%2023.6969'%20fill='%2334A853'/%3e%3cpath%20d='M31.6364%2015.8182V23.6969L38%2019.1515V16.7272C38%2014.4788%2035.305%2013.1969%2033.4182%2014.5454'%20fill='%23FBBC04'/%3e%3cpath%20d='M16.3636%2023.697V15.8182L24%2021.2727L31.6364%2015.8182V23.697L24%2029.1515'%20fill='%23EA4335'/%3e%3cpath%20d='M10%2016.7272V19.1515L16.3636%2023.6969V15.8182L14.5818%2014.5454C12.6918%2013.1969%2010%2014.4788%2010%2016.7272Z'%20fill='%23C5221F'/%3e%3c/g%3e%3cdefs%3e%3cclipPath%20id='clip0_4766_38693'%3e%3crect%20width='28'%20height='20'%20fill='white'%20transform='translate(10%2014)'/%3e%3c/clipPath%3e%3c/defs%3e%3c/svg%3e)

Optional context
- Previous quarter’s board deck (for continuity and comparison)
3. What Claude creates
Opus 4.6 works outward from the starting point you give it, pulls context from each source it finds, and saves three files locally: a presentation with narrative structure, a supporting data appendix, and an executive pre-read. Through Claude in Chrome, it opens the dashboards you named in new browser tabs and pulls the live numbers directly.
Here’s what I found and how I pieced it together:
I started with the Q3 project tracker, which pointed me to #platform-consolidation on Slack. The kickoff thread from July identified the core team: @maria (engineering), @james (partnerships), and @priya (customer success). From there:
- @maria’s weekly updates in #engineering-updates gave me the velocity metrics and the 22% cost reduction from consolidation.
- @james’s messages in #partnerships led me to the Apex term sheet in your local files and the close date (September 28).
- @priya flagged the two enterprise losses in #customer-success. I found the full churn details in a CSV on your desktop and the related email thread where both customers cited migration friction.
- The finance team’s Q3 report on Drive shows $4.2M revenue, but I pulled the Looker dashboard via Chrome and it shows $4.6M — the difference is the Apex revenue that closed after the report was finalized. I used $4.6M and noted the discrepancy in the appendix.
- Current NPS from Delighted (via Chrome): 47, down from 52 last quarter. The drop tracks with the two enterprise losses.
The quarter’s argument in one sentence: The platform consolidation cut engineering costs 22% and landed the Apex partnership, but migration friction cost you two enterprise accounts — and the retention data shows that’s a fixable execution problem, not a product problem.
I’ve saved three files:
- Q3 Board Presentation (q3-board-deck.pptx): 14 slides with speaker notes and anticipated board questions.
- Data Appendix (q3-data-appendix.xlsx): Six tabs covering revenue reconciliation, customer retention, NPS trends, engineering velocity, pipeline, and Apex partnership economics.
- Executive Brief (q3-executive-brief.docx): Two-page pre-read framing the consolidation bet and what the churn data actually shows.
4. Follow up prompts
The first deck is a draft to direct. Each follow-up below pushes on something the first pass produced: the slide count, the framing each board member needs, and the weak points in the argument.
Tighten the deck before you rehearse
Fourteen slides is more deck than most board slots hold. Cutting is easier when the appendix can absorb the detail.
Cut the deck to ten slides without losing the argument. Fold the engineering velocity detail into the appendix, merge the churn slides, and keep the revenue reconciliation slide intact. Update the speaker notes to match.
Pre-brief each board member on what matters to them
Opus 4.6 already knows the quarter’s full context. Use that to draft targeted pre-reads before the meeting.
Draft a Slack message for each board member based on what they’ll care about most. The CFO gets the revenue reconciliation and Apex economics. The product lead gets the consolidation impact and engineering velocity. The customer advocate gets the churn story and the NPS data. Personalize each one — don’t just cut the same deck three ways.
Stress-test the narrative before you present it
The hardest board questions come from the data you glossed over. Opus 4.6 has read every source and knows where the weak points are.
You’ve seen all the raw data. Play devil’s advocate — what are the three toughest questions the board could ask about this quarter, and where is our narrative weakest? Then update the speaker notes with how to handle each one, citing specific data points from the appendix.
5. Tricks, tips, and troubleshooting
Point Opus 4.6 at a starting resource and tell it to follow what it finds
Opus 4.6 can pull search terms from what it reads, so a document that names people, channels, and files gives it more threads to follow across your tools. A project tracker or kickoff doc works well. Once you have the tools you'd like Claude to access, tell it to work outward: "Follow each person across their channels, emails, and documents they reference. Check data against other sources." Paired with Cowork, it sustains that work across as many steps as the task requires.
Check the reconciled numbers before the board does
When sources disagreed, Claude chose a figure and noted the discrepancy in the appendix. Before the deck leaves your desk, open the revenue reconciliation tab, confirm the figure it chose matches the system you treat as the source of truth, and spot-check the slide that cites it.
Give it last quarter’s deck
Drop the previous board deck in with your local files. Claude picks up the structure the board has already seen and keeps the metrics comparable quarter over quarter.
6. Ready to try for yourself?
Point Opus 4.6 at your quarter.