1. Describe the task
Opus 5 maps what you already understand before trying to explain anything. It asks diagnostic questions, finds the specific point where your reasoning breaks, and builds the explanation from that gap.
From a single conversation, it produces three artifacts: an interactive lesson built around your misconception, a workbook that applies the concept to your own data, and a concept map connecting forward. Describe the concept you're stuck on and what you do understand. The prompt below does three things worth copying: it pins down the exact step where understanding breaks, it says what a good explanation would let you do afterward, and it attaches the data the workbook will be built from.
I keep running into “Bayesian reasoning” in things I read—essays, podcasts, even conversations at work. People say “update your priors” or “you’re ignoring the base rate” and I nod along, but I can’t actually follow the logic when it gets specific. I understand basic probability fine. I can calculate odds, I know what a conditional probability is in the abstract. But when someone explains why a 99% accurate test doesn’t mean a 99% chance you’re sick, I lose the thread halfway through.
Help me understand this. A good explanation is one I could redo with different numbers on my own, so check my reasoning as we go and I’ll tell you what lands and what doesn’t. Then build me an interactive lesson, a workbook I can use to audit which signals in my hiring pipeline actually predict success, and a concept map connecting it to what I’ll encounter next. I’ve attached our hiring pipeline export, applications through 12-month retention, so you can work from our real numbers.
2. Give Claude context
The diagnostic works from conversation alone. Files come in only when you want the workbook built from your own numbers.
Required context
- No files needed for the diagnostic itself. If you want a personalized workbook, attach a CSV or XLSX export of your data, the way the example prompt attaches a hiring pipeline export that runs from applications through 12-month retention. Opus 5 scans across the full dataset and builds the analysis around your actual figures.
Optional context
- Your screening or pipeline data: CSV or XLSX with candidate records, interview scores, hiring decisions, and outcomes, or any data where you're using a signal to screen or sort a population
- Extended Thinking(opens in new tab) gives Opus 5 space to think step by step before responding. For a task like this, where Claude needs to reason carefully about your knowledge structure to find a hidden misconception, that extra reasoning depth makes the diagnostic more precise. You can see Claude's thinking process as it works through the problem.
3. What Claude creates
Claude asks diagnostic questions first, probing what you know until it identifies the specific misconception. Then it rebuilds from the gap and produces all three artifacts. Opus 5 stays persistent through this entire sequence, and its writing keeps pace: the explanation, lesson, workbook, and concept map all maintain a consistent voice calibrated to your actual comprehension level.
Let me figure out where your understanding is solid and where it breaks.
You said you understand basic probability and conditional probability in the abstract. Quick scenario: a disease affects 1 in 1,000 people. A test is 99% accurate. You test positive. What's the probability you actually have the disease?
[After your response]
You said about 99%. That's the exact misconception I was looking for.
The answer is about 9%. Imagine testing 1,000 people. One has the disease, and the test catches them. But of the 999 healthy people, 1% get false positives. That's about 10 people. So you have 11 positive results, and only 1 is actually sick.
The core confusion: people treat the accuracy of a signal as the probability of the conclusion, without asking how common the thing they're looking for is. A hiring manager sees that 90% of successful hires had a certain trait, so they screen for it. But if 90% of all candidates have that trait, it predicts nothing.
Now let me build you three things you can keep.
Interactive lesson: Base rate explorer
[View the interactive lesson]
A simulator where you adjust base rates, test accuracy, and specificity across domains and watch how the ratio of true positives to false positives shifts in real time.
Signal audit workbook: your hiring pipeline
Since you uploaded your spreadsheet, I pulled your team's hiring data directly. Three tabs: your pipeline with base rates at each stage, a signal audit showing which interview criteria actually predict success (your technical assessment moves the needle from 8% to 34%; your culture fit score barely moves it), and a decision framework for evaluating any screening criterion.
[Download: signal-audit-workbook.xlsx]
Concept map: how Bayesian reasoning connects forward
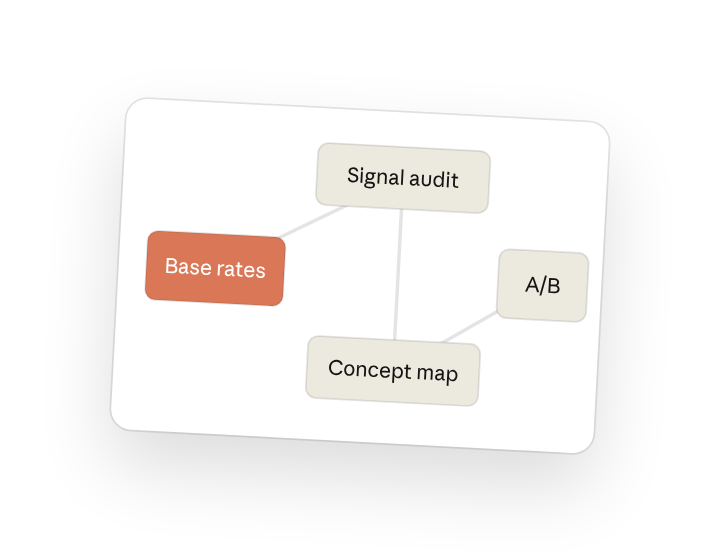
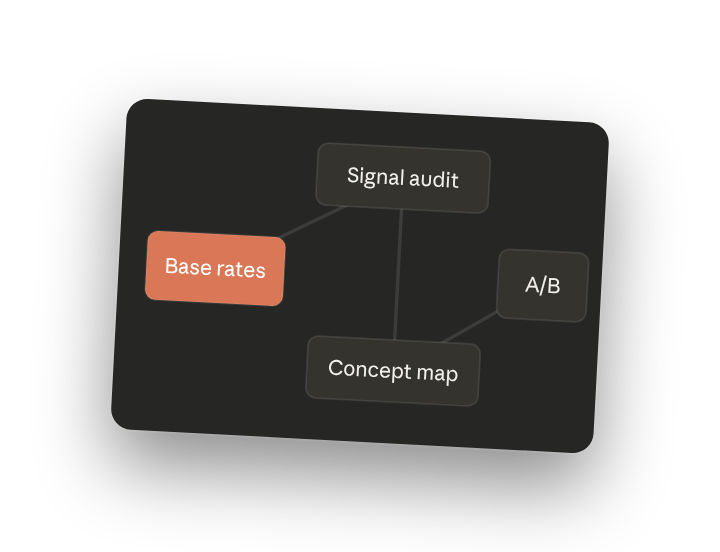
A one-page visual connecting base rate reasoning to signal detection theory, the prosecutor's fallacy, information gain, and why A/B tests need control groups. Each concept links to the reasoning chain that explains it.
[View the concept map]
4. Follow up prompts
Each follow-up below builds on something the first conversation produced: the signal audit, the workbook, and the concept map.
Test it against your own data
The workbook gives you the baseline. Push on the signal you most want to believe. Opus 5 scans across large files and datasets before responding, so it handles messy real-world numbers without oversimplifying.
Walk me through which interview criteria actually predict success once you factor in the base rates. I especially want to know about our new case study exercise—we added it in Q3 and our hire quality seems better. Is the case study a real signal or are we seeing what we want to see?
Keep working in your spreadsheet
Open the workbook in Excel and continue the analysis with Claude in Excel(opens in new tab). Claude works directly in a sidebar in Excel, where it can read your data, modify formulas, and build on the workbook without leaving your spreadsheet.
I downloaded the signal audit workbook. Can you add a tab that checks whether any of our interview signals are redundant—measuring the same thing as another signal we already screen for? I want to cut the ones that aren’t adding new information.
Build a longer learning sequence
Work through the concept map one piece at a time. Opus 5 carries instructions through longer conversations without drifting, so the diagnostic context holds as you move through related topics.
Now that I understand base rates, I want to build out my understanding of the related concepts on the map—signal detection theory, information gain, and the prosecutor's fallacy. Can you create a learning sequence that covers them one at a time, with a workbook exercise for each?
5. Tricks, tips, and troubleshooting
Front-load what you know
Opus 5 invests in understanding your knowledge structure before trying to change it. The more clearly you describe where your understanding is solid, the faster Claude can locate where it breaks. What you get out mostly reflects what you put in, so spend your effort describing your starting point rather than hunting for the perfect phrasing. “I understand basic probability but I can’t follow base rate arguments” is a sharper starting point than “I don’t understand statistics.” The gap between what clicks and what doesn’t is usually where the misconception lives.
Say it once
You don’t need to repeat your requirements or add “and remember to...” reminders. Opus 5 follows instructions precisely through the full diagnostic, the artifact construction, and any follow-ups. State what you want upfront and trust that it carries through.
Check the workbook against your own data
Before you change a screening step based on the signal audit, pick one figure from it, like the success rate behind your strongest signal, and recount it from the raw rows in your export. If your hand count matches, you can rely on the rest of the tab. If it doesn't, tell Claude which number is off and it rebuilds the calculation and shows its work.
6. Ready to try for yourself?
Describe a concept you're stuck on and what you do understand. Claude builds the explanation from there.