1. Describe the task
Claude can read across your company channels, identify what matters to you, and package it into a publication-style digest. You get curated company intelligence delivered in a format you'll actually want to read.
Tell Claude which week to summarize and point to the channels or topics that matter most. Ask for an interactive publication with data visualizations showing data and trends.
Create a weekly digest for Oct 14-20 for my company.
Pull information from relevant channels in my Slack, such as #company-announcements, #product-updates, #leadership, and any other channels where major decisions happened.
Include data visualizations where useful. Use a dense but readable layout. Pack information efficiently and use sophisticated typography and spacing.
Go for a British newspaper aesthetic: no gradients, shadows, rounded corners, or bright colors. Print-like typography with tight leading. Include institutional publishing elements—standfirsts, pull quotes with left borders, desk attributions, sourced charts using Chart.js. This should look hand-crafted by an editorial designer. Include substantive developments formatted like a real publication I'd read on Sunday evening.
2. Give Claude context
To create your digest, Claude needs access to your workspaces. Claude can read across all your channels to identify which updates are important to include.
For a more complete view, add additional sources where company information that you want to include lives.
Required context
In Settings > Connectors, find and enable your Slack(opens in new tab) connector and Google Drive(opens in new tab) and Gmail(opens in new tab) integrations.
Google Drive documents, coupled with Gmail and Slack discussions, offer both informal and formal information for complete coverage.

'%3e%3cpath%20d='M11.9091%2034H16.3636V23.6969L10%2019.1515V32.1818C10%2033.1879%2010.8559%2034%2011.9091%2034Z'%20fill='%234285F4'/%3e%3cpath%20d='M31.6364%2034H36.0909C37.1473%2034%2038%2033.1848%2038%2032.1818V19.1515L31.6364%2023.6969'%20fill='%2334A853'/%3e%3cpath%20d='M31.6364%2015.8182V23.6969L38%2019.1515V16.7272C38%2014.4788%2035.305%2013.1969%2033.4182%2014.5454'%20fill='%23FBBC04'/%3e%3cpath%20d='M16.3636%2023.697V15.8182L24%2021.2727L31.6364%2015.8182V23.697L24%2029.1515'%20fill='%23EA4335'/%3e%3cpath%20d='M10%2016.7272V19.1515L16.3636%2023.6969V15.8182L14.5818%2014.5454C12.6918%2013.1969%2010%2014.4788%2010%2016.7272Z'%20fill='%23C5221F'/%3e%3c/g%3e%3cdefs%3e%3cclipPath%20id='clip0_4766_38693'%3e%3crect%20width='28'%20height='20'%20fill='white'%20transform='translate(10%2014)'/%3e%3c/clipPath%3e%3c/defs%3e%3c/svg%3e)

3. What Claude creates
Claude reads across all your channels, filters for important discussions, and organizes updates into topic-based sections. You'll receive a clear summary of events, without needing to piece together information from various messages.
Here's your digest for October 27-31:
View your Interactive HTML artifact(opens in new tab)
The publication includes:
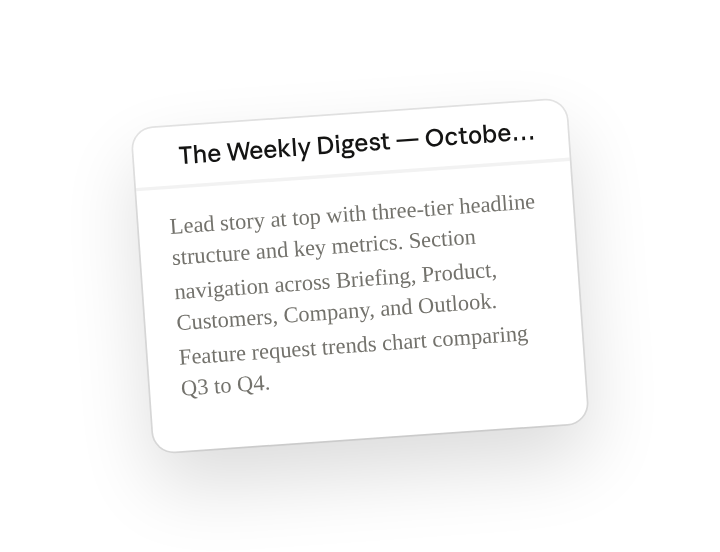
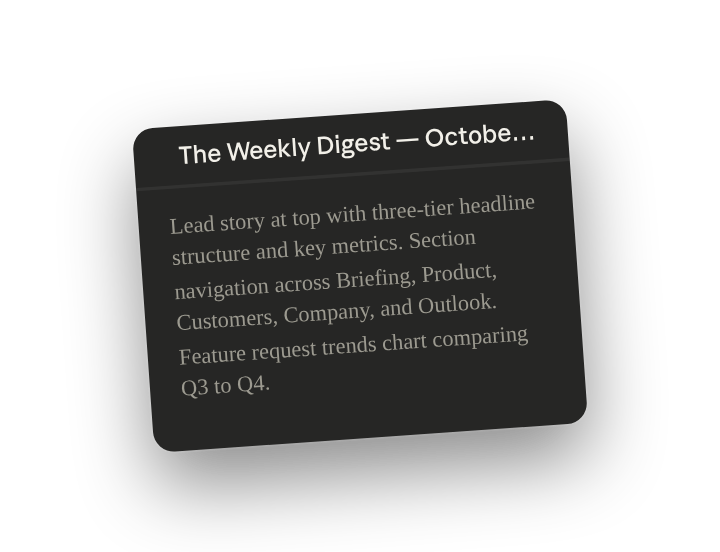
- Lead story at top with three-tier headline structure and key metrics
- Section navigation (Briefing, Product, Customers, Company, Outlook)
- Feature request trends chart comparing Q3 to Q4 (interactive Chart.js bar chart)
- Customer feedback volume over time (line chart showing requests, positive feedback, issues)
- Article summaries with desk attribution and read times
- Metric cards showing revenue closed, pipeline status, key numbers
- Deal activity cards organized by outcome (closed, pipeline, lost)
You can share the artifact link, convert to PDF for printing, or ask me to post a condensed version to Slack.
4. Follow up prompts
Continue the conversation with Claude to refine, expand, or explore further.
Expand coverage and depth
Add more pages and mimic a full publication. Tell Claude to include more channels in its search and create corresponding sections for each.
Turn this artifact into a complete online publication with clickable sections and full articles. Give each department its own section with more in-depth analysis, charts, pull quotes, and context.
Add visualizations
Include charts, tables, or other visual elements to make new data and trends immediately visible.
Add Chart.js visualizations: customer sentiment (positive vs issues, 4-week trend), engineering velocity (features shipped per week), pipeline breakdown by stage with values. Use line charts for trends, bar charts for comparisons.
5. Tricks, tips, and troubleshooting
Use prompting techniques to trigger specific designs
The prompt includes phrases like "Print-like typography" or "Institutional publishing elements". These descriptions help inspire Claude to design and format your information in a way that mimics digital publications and online news sites. Without them, Claude may default to more basic formatting.
Publish and share the artifact
After Claude creates an artifact, publish and share it(opens in new tab) through the URL. Others can open it in the browser, without needing a Claude account. If someone requests changes, you can ask Claude to update the artifact and republish to display the new version.
Tune preferences over time and create skills
As you discover how you like your content formatted and which channels for sourcing information work best, give Claude feedback and ask to create a Skill(opens in new tab). Learn more about how to create a custom skill using Claude.(opens in new tab)
6. Ready to try for yourself?
Connect your company tools and get a readable digest, turning minutes of curated reading instead of hours catching up across channels and platforms.